Download
Install
After downloading OWLGrEd, extract (unzip) the archive. Then start the owlgred.exe directly, or create a shortcut for it.
At the first start you may be asked for elevated rights as the tool needs to register an OCX component for graphical diagrams. On some configurations, it might be necessary to run OWLGrEd with administrator privileges at the first start. To do that, navigate into the unzipped folder, right click on owlgred.exe and select "Run as Administrator" from the context menu.
You should see a message that the OCX registration has succeeded.
Visualize
You can visualize an existing ontology by selecting "Visualize Ontology" from the splash window when opening OWLGrEd for the first time. Additional ontologies can be visualized from the project diagram's context menu item "Load Ontology".

From Splash Window
Click on "Visualize Ontology" and select an .owl file you want to visualize.
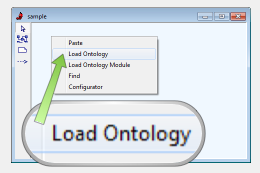
From Context Menu
Right click on the Project Diagram canvas and select "Load Ontology" from the context menu.
Edit
To create a new ontology, select "OWL" tool from the Project Diagram's palette, then click on the diagram canvas where you want to place the ontology node. Afterwards a new window will open where you can edit the ontology name and other meta data. After closing the window you can open the created ontology with a double click on the ontology node.
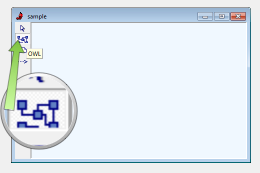
Create Ontology
Select the "OWL" tool from the Project Diagram's Palette and click on the canvas. Afterwards double click on the created node, to open the ontology.
Export
To save an ontology to an .owl file, right click on the ontology canvas and select "Save Ontology" from the context menu.
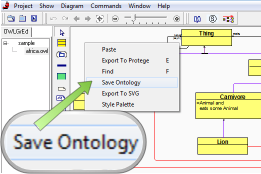
Export to an .owl file
Right click on the ontology canvas and select "Save Ontology" from the context menu.
Share
You can share your ontology with others on the web by exporting it to the SVG format and by placing it in your HTML file. Right click on the ontology canvas and select "Save Ontology" from the context menu. Alternatively you can export to a picture file by selecting "Diagram → Save As Picture → Diagram..." from the menu bar.
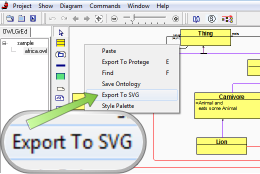
Export to SVG
Right click on the ontology canvas and select "Export To SVG" from the context menu.
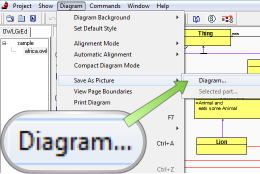
Export to Picture
Select "Diagram → Save As Picture → Diagram..." from the menu-bar, and select picture format in the dialog.
Customize
Ontology layout mode can be changed through "Diagram → Automatic Alignment" in OWLGrEd toolbar.
The way elements are displayed can be changed in the style dialog. To open the style dialog, right-click on an element you want to modify and select Change Type Style. Some of the things you can change in the style dialog are: node shape and background color, line color and routing, compartment (text field) visibility and font.
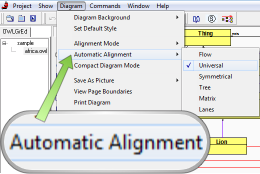
Change Layout
The layout algorithm can be changed from the menu bar. Select "Diagram → Automatic Alignment → ...".
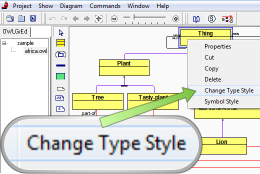
Change Element Type Style
Right click on the element you want to change. Select "Change Type Style" from the context menu.